Tuesday, December 30, 2014

Why Everybody Is Moving to Texas


Texas has become one of the hottest places to move to for both personal and business reasons over the past 5 years. In fact, over the past 5 years, more Americans—over 387,000 in 2013 alone—have chosen to move to Texas over any other state.
So what’s the big draw, y’all?
Best Reasons to Move to Texas
The number-one reason most people are relocating to other cities these days is their job situation—either they are looking to increase their earnings and career longevity or they have been unable to find a job in their current location and are moving for more opportunities.
The second most popular reason for relocating is housing affordability. For many people, these two reasons go hand in hand. Finding a place where they can secure a solid, good-paying job and purchase a home with increasing value in a nice neighborhood provides a great plan for long-term financial success and family security.
According to a recent study by Redfin, 9 of the top 10 fastest-growing U.S. metropolitan areas are those in which housing prices are the most affordable in the country. Of the top 20 fastest-growing cities, 5 belong to the Lone Star State: Austin, Houston, San Antonio, Dallas and Fort Worth.
Austin’s surge in population can easily be attributed to its consistently solid employment rate over the past 10 years. With an unemployment rate of just 4.6 percent and a projected growth rate of more than 4 percent by the end of 2015, Austin continues to have one of the strongest job markets in the state.
Another draw to the state is a low tax rate. This is especially important for many of the companies that are choosing to uproot themselves from the East and West Coasts and move inward to Texas. A lower tax rate and affordable real estate prices make it a no-brainer for larger companies wanting to save and smaller companies looking for a way to secure their financial future.
Monday, December 8, 2014

DFW Home Prices Rise 9.1% in October

Dallas-Fort Worth area home prices increased 9.1. percent in October year-over-year, outpacing the national average, according to the latest CoreLogic report releasedTuesday.   Overall, the country's home prices have been slowing down in the past few months and has only grown at moderate levels, according to economists.  "Home price growth is moderating as we head into the late fall and is currently running at half the pace it was in the spring of 2014," said Sam Khater, deputy chief economist at Corelogic, in a statement. "However, there are still pockets of strength, especially in several Texas markets, especially Dallas and Houston and other markets with strong economic fundamentals."   Based on CoreLogic projections, economists expect home prices to continue to rise, with home prices in over half of the United States to reach or surpass levels seen at the height of the housing bubble sometime in mid-2015.
-          Dallas Morning News, December 2, 2014

Tuesday, December 2, 2014

Dallas-Area Home Prices Reach Record

Dallas-Area Home Prices Reach Record
Prices of preowned homes in the Dallas area were up 7.4 percent in the latest Standard & Poor’s/Case-Shiller Home Price Index.  The gain in September from a year ago was the fourth highest in the country – significantly ahead of the 4.9 percent nationwide increase.  Home price increases nationwide have slowed in recent months, but in the Dallas area, the year-over-year price increases have remained steady.  Charlotte, North Carolina and Dallas continue to have price increases considerably above the national average.   Dallas-area home prices are now 12 percent higher than they were before the recession and at record level in the Case-Shiller index.
-          Dallas Morning News, November 26, 2014

Wednesday, October 1, 2014

NEW HOME SALES JUMP, RESALES DIP

NEW HOME SALES JUMP, RESALES DIP
Existing home sales slumped 1.8% in August – their first retreat since March, according to the National Association of Realtors. This followed gains of 2% or more in each of the previous three months. News about new home purchases was better: the Census Bureau recorded an 18.0% increase for August, more than making up for two months of declines. Keep in mind that these numbers may be significantly revised (as an example, May’s apparent 18.6% advance in new home buying was reduced to an 8.3% gain a month later)

Friday, September 26, 2014

DALLAS UPTOWN: High Property Prices

High Uptown Property Prices Pushing Dallas Development
to New Urban Neighborhoods

http://cdn.thinglink.me/api/image/569333411513106432/1024/10/scaletowidth#tl-569333411513106432;1043138249'

Is there life after Uptown for real estate developers?  For the last decade, the district north of downtown has been the hottest development market in Dallas.  But with prime land prices soaring past $200 per square foot and fewer empty lots to build on, commercial property companies are looking at nearby neighborhoods.

West Dallas, the Design District, the Farmers Market, South Side and near East Dallas are now at the top of apartment builders’ shopping lists.  “It is getting very difficult to justify dirt cost in Uptown, if you can even find a site,” said Ryan Miller of apartment builder Wood Partners. “With higher dirt prices, escalating construction costs and concern for rents capping out, it makes Uptown more and more risky.  ”We have been targeting alternative submarkets that are just as close to jobs and nightlife with dirt at a lower basis, which means we can keep our rents in check,” Miller said.

Wood Partners has rental communities under construction at the Farmers Market, in West Dallas and in the Medical District on Maple Avenue.  Most of these are neighborhoods that developers wouldn’t have crossed the street to look at a decade ago.  “We’ve done an incredible job in Dallas of pushing successful development into unproven areas,” said Greg Willett, vice president of Carrollton-based apartment consultant MPF Research. “We’ve done it with the Knox-Henderson area and the Design District.  “And I’m optimistic about the development that’s going to these other areas,” including West Dallas and the Farmers Market area, Willett said.   With average apartment rents for new units now running $1,800 a month in Uptown and downtown, Willett said it’s important for developers to offer locations with slightly lower prices. “If there is any concern about how much we are building, it’s how expensive it is and if we are going to run out of people who can afford the rents,” he said.

In the suburbs, retail and restaurants usually follow new rooftops.  But in booming West Dallas and north Oak Cliff neighborhoods, new housing is following successful restaurants and shops that have made residents comfortable with the areas.  “Sometimes the customer doesn’t know they want to be there because the product hasn’t been there before — you have to give them the product,” said Dallas developer Michael Ablon, who’s played an important role in turning the Design District into a popular restaurant and apartment address.

Ablon said many potential renters are being priced out of Uptown.  “They only product you can build in Uptown is the upper echelon — you can only do apartments at the premium price point,” he said.  But low land costs alone can’t be the basis for new urban neighborhoods, Ablon said. “In some of these other areas, I have a hard time knowing who really wants to be there,” he said.  Longtime Dallas real estate broker Newt Walker said Uptown is still ground zero for urban development in Dallas.  “If you build it in Uptown, they will come,” said Walker. “A lot of developers are crossing the Trinity River, but it’s still somewhat uncharted waters.  “The question is, what’s the depth of the market there?”

Apartment builders are betting that proximity to the central business district and postcard skyline views will bring young, professional apartment renters to nearby neighborhoods.  “People are excited again by the inner city and want a more urban lifestyle,” said Doug Chesnut, one of the founders of Dallas-based development firm StreetLights Residential. “We are running out of land — affordable or unaffordable — in Uptown, so we must continue to expand our geographic footprint.” 
StreetLights, which has built an Uptown apartment tower and has a second under construction, has contracted to purchase a former industrial site on Singleton Boulevard in West Dallas where it plans hundreds of new apartments and homes.  “The Calatrava bridge and Trinity Groves opened a new gateway to the west, just as other gateways are opening to new areas east and south of the central business district,” Chesnut said. “People are moving to North Texas, whether we like it or not, and we need to provide housing and amenities for those people.”
-          Dallas Morning News, September 19, 2014

Monday, September 22, 2014

New Report Shows DFW is a Top Market for Home Sellers

New Report Shows DFW is a Top Market for Home Sellers
Dallas-Fort Worth is ranked as one of the best markets in the country to sell a house, according to a new study. Zillow Inc. said the D-FW area is the fourth best place in the country for home sellers.  “Sellers in the Bay Area, Seattle and Dallas have the most negotiating power, with final sale prices largely at or above asking,” Zillow’s report says.  Zillow said that overall home prices in D-FW were up 5.8 percent in August from a year ago and there were about 5 percent fewer houses on the market.  U.S. home values will continue to rise during the year ahead, but at a slower rate than last year, according to Zillow.  D-FW home prices are forecast to increase by about 4 percent in the next 12 months.
http://bizbeatblog.dallasnews.com/files/2014/09/sellers-300x168.jpg
-          Dallas Morning News, September 19, 2014

Thursday, September 11, 2014

Dallas Skyline Voted Best in the World

http://whateverblog.dallasnews.com/files/2014/09/SKYLINE-500x333.jpg

We’re No. 1
Dallas Skyline Voted Best in the World
Eat that, Bid Apple.  Sorry, Chicago.  Dallas is No. 1.    Our fair city just took first place in USA Today’s Best International Skyline reader’s choice poll, coming out ahead of No. 2 Chicago for ultimate bragging rights.  USA Today cited our skyline’s colorful lighting, and pointed out that people flying in to DFW and Love Field airports get a great view at night.  The top 10 finishers: 1) Dallas, 2) Chicago, 3) Rio de Janeiro, 4) Toronto, 5)New York, 6) Washington, D.C., 7) St. Louis, 8) Hong Kong, 9) San Francisco, and 10) Seattle.
-          Dallas Morning News, September 9, 2014

Friday, September 5, 2014

Dallas Home Prices Growing Faster Than the Nation

Dallas Home Prices Growing Faster Than the Nation
Dallas-area home prices are growing faster than the nationwide rate, according to the latest study by CoreLogic Inc.  Dallas prices rose by 9 percent from a year ago in July, according to CoreLogic’s new report.  That’s ahead of the 7.4 percent nationwide increase.  The largest increases were in Riverside, Calif. (13.8 percent) and Houston (11.8 percent).  CoreLogic forecasts that nationwide home prices will grow by almost 6 percent over the coming year.  “Home prices continued to march higher across much of the U.S. in July.  Most states are reaching price levels not seen since the boom year of 2006,” Anand Nallathambi, president and CEO of CoreLogic, said in a statement. “Our data indicates that this trend will continue, with more states hitting new all-time peaks this year and into 2015 as the recovery continues.”
-       MetroTex News, September 2, 2014
-        

Tuesday, August 12, 2014

Texas Economy Continues to Boom

Texas Economy Continues to Boom
The Texas economy grew faster in the second quarter, thanks largely to the booming energy industry and strong commercial real estate activity, according to a report by the Federal Reserve Bank of Dallas.  Employment growth is a big part of that picture. Texas’ annualized job growth rose from 2.4 percent in the first quarter to 4.3 percent in the second quarter — the strongest pace in nearly nine years. And that happened even though employment growth slowed in May and June.  The state’s job creation is outpacing the nation’s in all major industries except construction, manufacturing and other services in the first half of 2014. The Dallas Fed forecasts 3.5 percent employment growth this year, or 400,000 new jobs.
-          Dallas Morning News, August 11, 2014


Thursday, July 24, 2014

Dallas-Ft Worth’s Economic Growth Outpaces Texas


Dallas-Ft Worth’s Economic Growth Outpaces Texas
The Dallas-Fort Worth economy has grown faster than the state average and its employment has increased faster than any other Texas major metro area in the first half of the year, according to a report issued yesterday by the federal reserve Bank of Dallas.  DFW employment has grown 4.5 percent this year through June, compared with 3.5 percent growth with Texas.  Local job creation in the second quarter (5.5 percent or 42,600 jobs) outpaced first quarter growth (3.4 percent or 26,500 jobs).  Most of the region’s employment gains have come from fast growth of the Dallas economy, which has added jobs at a 5.4 percent pace in the first half of the year.  The professional and business service sector saw the most growth.  Manufacturing is the only local industry to lose jobs (-700) in the first six months of the year.
-          Dallas Business Journal, July 22, 2014

Wednesday, July 9, 2014

Dallas No Longer in Top 10 for Traffic Congestion

Dallas No Longer in Top 10 for Traffic Congestion
The nation's worst rush-hour traffic can be found, not surprisingly, in Los Angeles. But the No. 2 city is a surprise.   Each year, three organizations produce traffic congestion reports.   The reports estimate the “excess travel time” lost in traffic congestion during morning and evening weekday rush hours.     This excess time is relative to the travel time that would be expected if traffic were free-flowing and there was no congestion.   The Los Angeles metropolitan area notches the worst traffic congestion in all three reports — 44.4 percent excess travel time. The second worst congestion is in Austin, Texas, with 34.5 percent excess travel time.   San Francisco (34.4 percent) is No. 3 and New York (33.4 percent) is No. 4. Both cities have a high population density.   Seattle is No. 5 at 32.4 percent, due in part to the cancellation of some planned freeways.   Rounding out the worst 10 are San Jose, Calif. (32.2 percent); Washington, D.C. (31.3); Boston (29.7); Houston (28.3); and Portland, Ore. (28.2).
-          Newsmax, July 6, 2014

Friday, June 27, 2014

Plano Approves Legacy West, Toyota, Fed Ex


http://friscoblog.dallasnews.com/files/2014/06/master-plan-57-300x207.jpghttp://www.dallasnews.com/business/commercial-real-estate/headlines/20140313-legacywestmodel.jpg.ece/BINARY/w620x413/legacywestmodel.jpg
Dallas Cowboys Development                   Legacy West with Toyota, Fed Ex, Renaissance Hotel
Dallas Cowboys Development Began Wednesday
Work began Wednesday on the future home of the Dallas Cowboys in Frisco, city officials confirmed.   Mass excavation is expected to start the week of July 7.   The city, the Cowboys and Frisco ISD have partnered on the development, which will include the team’s headquarters, outdoor practice fields and a 12,000-seat multi-use event center at the northwest corner of Warren Parkway and Dallas North Tollway.   The city and the school district have pledged $115 million for the public portion of the 91-acre site. Any costs above that will be paid by the Cowboys’ ownership. About 66 acres at the site will be developed separately by the Blue Land companies owned by Cowboys owner Jerry Jones and his family. That acreage will include retail, restaurants, office space and a hotel.  The indoor stadium and training facilities are expected to be completed in late summer 2016. The stadium will be used not only for Cowboys training but for high school football games and other events.   A ceremonial groundbreaking is planned sometime in August.
-          Dallas Morning News, June 24, 2014

Plano Approves Legacy West, Toyota, Fed Ex
The Plano City Council approved a rezoning request Monday that paves the way for a 205-acre mixed-use project near the J.C. Penney headquarters. The council approved the request to rezone the  undeveloped land, located at the southwest corner of State Highway 121 and the Dallas North Tollway, from commercial employment to central business to allow for greater development flexibility.  Developers plan to break ground after the first of the year on the project that’s part of the Legacy West development, which will surround J.C. Penny’s corporate headquarters. Legacy West will also include Toyota’s new North American headquarters and the new FedEx office building.  The development will include hotel, commercial, retail, office buildings and residential.
-          Dallas Morning News, June 24, 2014

Thursday, June 12, 2014

Next Portion of LBJ Freeway (I-635) Dallas, TX Expansion to Open July 12

Next Portion of LBJ Freeway Expansion to Open July 12

http://transportationblog.dallasnews.com/files/2014/06/LBJ-35.jpg

The second phase of LBJ Freeway’s massive, $2.7-billion expansion will open July 12, developers announced today. This is the portion that includes LBJ’s interchange with Interstate 35E. If you’ve driven 35E lately, you’ve seen the new lengthy bridges that will be tolled and will connect that thoroughfare with LBJ. The interchange will feature the dynamic toll pricing that goes into effect on LBJ at midnight tonight.
-          Dallas Morning News, June 11, 2014

Wednesday, June 4, 2014

Home Prices Rise by 10.5 Percent Year Over Year in April

CoreLogic Reports Home Prices Rise by 10.5 Percent Year Over Year in April


June 03, 2014, Irvine, Calif. –

—––CoreLogic HPI Forecast Indicates National Home Prices Are Expected to Rise by 6.3 Percent from April 2014 to April 2015—

CoreLogic® (NYSE: CLGX), a leading global property information, analytics and data-enabled services provider, today released its April CoreLogic Home Price Index (HPI®) report. Home prices nationwide, including distressed sales, increased 10.5 percent in April 2014 compared to April 2013. This change represents 26 months of consecutive year-over-year increases in home prices nationally. On a month-over-month basis, home prices nationwide, including distressed sales, increased 2.1 percent in April 2014 compared to March 2014.*
At the state level, including distressed sales, no states posted depreciation in April 2014. Additionally, Colorado, Louisiana, Nebraska, Oklahoma, North Dakota, South Dakota, Texas and Wyoming all surpassed their previous home price peaks. In all, 23 states and the District of Columbia are at or within 10 percent of their peak home price appreciation.
Excluding distressed sales, home prices nationally increased 8.3 percent in April 2014 compared to April 2013 and 1.1 percent month over month compared to March 2014. Distressed sales include short sales and real estate owned (REO) transactions.
The CoreLogic HPI Forecast indicates that home prices, including distressed sales, are projected to increase 1.0 percent month over month from April 2014 to May 2014 and by 6.3 percent (+/- 1.5 percent)** from April 2014 to April 2015. Excluding distressed sales, home prices are expected to rise 0.8 percent month over month from 1.0 percent month over month from April 2014 to May 2014 and by 5.5 percent (+/- 1.5 percent)** from April 2014 to April 2015. The CoreLogic HPI Forecast is a monthly projection of home prices built on the CoreLogic HPI and other economic variables. Values are derived from state-level forecasts by weighting indices according to the number of owner-occupied households for each state.
“The weakness in home sales that began a few months ago is clearly signaling a slowdown in price appreciation,” said Sam Khater, deputy chief economist for CoreLogic. “The 10.5 percent increase in April, compared to a year earlier, was the slowest rate of appreciation in 14 months.”
“Home prices are continuing to rise as we head into the summer months,” said Anand Nallathambi, president and CEO of CoreLogic. “The purchase market continues to suffer from a dearth of inventory which we expect will continue to drive prices up over the year.”
Highlights as of April 2014:
  • Including distressed sales, the five states with the highest home price appreciation were: California (+15.6 percent), Nevada (+14.8 percent), Hawaii (+14.1 percent), Oregon (+11.8 percent) and Michigan (+11.3 percent).
  • Excluding distressed sales, the five states with the highest home price appreciation were: Hawaii (+13.0 percent), California (+11.4 percent), Nevada (+11.1 percent), New York (+10.3 percent) and Florida (+10.2 percent).
  • Including distressed transactions, the peak-to-current change in the national HPI (from April 2006 to April 2014) was -14.3 percent. Excluding distressed transactions, the peak-to-current change in the HPI for the same period was -10.8 percent.
  • Excluding distressed sales, all 50 states and the District of Columbia showed year-over-year home price appreciation in April.
  • Including distressed sales, the U.S. has experienced 26 consecutive months of year-over-year increases; however, this is the smallest year-over-year increase since February 2013.
  • The five states with the largest peak-to-current declines, including distressed transactions, were: Nevada (-38.6 percent), Florida (-34.5 percent), Arizona (-29.5 percent), Rhode Island (-28.8 percent) and West Virginia (-24.2 percent).
  • Ninety-five of the top 100 Core Based Statistical Areas (CBSAs) measured by population showed year-over-year increases in April 2014. The five CBSAs that did not show an increase were: Hartford-West Hartford-East Hartford, Conn.; Milwaukee-Waukesha-West Allis, Wis.; Little Rock-North Little Rock-Conway, Ark.; Worcester, Mass.-Conn.; New Haven-Milford, Conn.
*March data was revised. Revisions with public records data are standard, and to ensure accuracy, CoreLogic incorporates the newly released public data to provide updated results.
** The forecast accuracy represents a 95-percent statistical confidence interval.

Tuesday, June 3, 2014

AFFORDABILITY OF U.S. CITIES FOR FIRST TIME HOME BUYERS

New Listings Reaching Normalcy
The increasing amount of new listings over the past 60 days in the DFW Metro market is showing signs that we are reaching a normal market for new listings. However, the huge inventory of buyers well exceed the supply of listings and all indications are that our strong seller’s market will continue for the next two to three years, with a continual increase in home prices. Approximately 18,900 homes came on the market in May 2014, compared to 17,468 new listings in May 2012. That is a healthy 9% increase. It was in May 2012 when the DFW Metro market made a significant correction, with May the last month of a buyer’s market to August 2012 when the region had become a seller’s market.

AFFORDABILITY OF U.S. CITIES FOR FIRST TIME HOME BUYERS
A starter home in San Francisco is $679,800, but in Cleveland it is only $102,100. But it takes a hefty income of
$137,129.55 in San Francisco to purchase the starter home. Dallas now ranks 16th in most expensive housing markets,
a huge change over the last many years when Dallas was always one of the most affordable cities.
CITY
Income Needed
Starter Home
Price Change from 2013
1. San Francisco
$137,129.55
$679,800
14.50%
2. San Diego
$98,534.22
$483,000
17.10%
3. New York City
$89,788.69
$388,900
5.60%
4. Los Angeles
$85,964.88
$406,200
17.60%
5. Boston
$79,820.01
$363,200
9.30%
6. Washington, DC
$78,503.56
$358,900
2.90%
7. Seattle
$73,851.06
$339,900
8.70%
8. Portland
$60,307.71
$271,900
10.30%
9. Denver
$59,892.46
$288,400
10.40%
10. Miami
$59,734.23
$259,000
15.10%
11. Sacramento
$58,113.87
$255,800
22.20%
12. Baltimore
$53,078.51
$224,500
-0.90%
13. Chicago
$52,866.88
$176,900
11%
14. Philadelphia
$50,546.25
$201,800
2.10%
15. Houston
$49,036.60
$184,600
12.80%
16. Dallas
$47,708.77
$174,800
9%
17. Minneapolis
$45,732.39
$188,200
10.30%
18. San Antonio
$44,506.00
$169,300
8%
19. Orlando
$43,243.95
$178,000
18.70%
20. Phoenix
$41,308.74
$194,300
15%
21. Tampa
$36,437.56
$145,000
7.40%
22. Atlanta
$34,183.44
$141,900
23.30%
23. Detroit
$32,250.30
$110,750
35.60%
24. Cincinnati
$31,850.18
$121,700
0.06%
25. St. Louis
$31,275.49
$120,500
8.60%
26. Pittsburgh
$30,177.78
$120,000
-1.80%
27. Cleveland
$29,788.67
$102,100
1.10%

Thursday, May 29, 2014

More Home Buyers Are Bringing All-Cash Offers to the Table

More Home Buyers Are Bringing All-Cash Offers to the Table
And more of these buyers are individuals, not the institutional investors who plunged into the housing market in 2012 and 2013.   Wealthy people, foreigners and retirees are transforming markets across the United States with these all-cash deals, helping make up for an alarming shortage of first-time buyers who are struggling to save for a down payment or qualify for a loan, a cause of grave concern about the long-term health of the market and its prospects for a true recovery.  “It’s the investor and the wealthy individual that’s keeping the market alive,” said Mark Zandi, chief economist at Moody’s Analytics.  “The wealthy buyers in particular are fully engaged now. The stock market is up and times are good for them.”    But it is a frustrating time for first-time buyers who cannot compete because their offers included financing contingencies, appraisals and inspections.
-          Washington Post, May 26, 2014

Tuesday, April 22, 2014

Wood Is Good: The Must–Have Material For Your Spring Home Spruce-Up

Wood Is Good: The Must–Have Material For Your Spring Home Spruce-Up

Thinking of sprucing up your home for spring? You're not alone; one in three homeowners say they'll take on at least one home improvement project in the first half of 2014, according to a recent survey by Burst Media. And it turns out, freshening your home for spring is a smart investment.

Home sales and prices are up, and mortgage rates are still considered low by historical standards. The combination is a recipe for a strong 2014 home remodeling forecast. Homeowners are regaining equity in their homes, and that confidence is expected to spur them to take on deferred projects for their own enjoyment, or upgrade their homes for sale.

In its annual survey, Remodeling Magazine reports that wood deck additions deliver the second highest return on investment of the home improvement projects surveyed. If you're looking for a way to make your spring spruce–up add value to your home, wood is a great option. Wood is known for its versatility, ease of use and natural beauty.

Whether you're looking to update your living space or transform your outdoor entertaining area, Mark and Theresa Clement, home improvement pros, offer simple, do–it–yourself tips for incorporating wood into your spring home improvement projects:

Prepping Decks for Spring Entertaining
"One of the best things you can do in the spring to spruce up your house is to clean and refinish your wood deck," Mark says. "The natural beauty of a well–maintained deck transforms a backyard into a gathering place."

After you've carefully cleaned the deck to remove dirt and debris, choose a finish. Both sealers and stains are designed to seal out elements. Clear sealers contain no pigment, allowing the natural beauty of the wood to show through. Stains may contain a little pigment (labeled as "tone" or "transparent"), be semi–transparent or come in solid colors. Avoid paint, which can form a film on top of the wood and bubble or flake.

Can't decide between a semi-transparent stain and a water–repellant sealer? Try using the sealer first. If you change your mind later, it's easy to switch to a semi-transparent stain when the deck needs to be refinished. If you do opt for a sealer, use one that contains ultraviolet light–blockers to protect against sun damage and mildewcides to inhibit the growth of mildew.

Add Crown Molding to a Room
Crown molding imparts an upscale, elegant air to any room — and you only need basic DIY tools to install it.

"Crown molding bridges the junction of walls and ceilings — a prominent visual location where an architectural accent can really shine," says Theresa. "While crown molding is a high–impact, higher–difficulty project, it's well within the abilities of most DIYers. Plus, you probably already have the tools you need in your toolbox — with a miter saw, nails and a hammer, you can transform your favorite room with a custom finish."

When choosing your molding, remember to keep a consistent scale from floor to ceiling.

You may be tempted to install a wide, impressive crown molding and skimp on the base or casings, but molding sizes need to be balanced throughout the room. Wherever possible, use corner pieces, plinth blocks and other transition pieces — they make installation simpler, minimize the need for miter cuts and help joints stay closed despite seasonal changes in humidity. Finally, don't paint your crown molding and trim. Instead, opt for a clear sealer and allow the natural texture of the wood to shine through, adding warmth, personalization and a natural touch to your interior decor.

Install Wainscoting
Wainscoting has long been a hallmark of fine construction and design. Wood paneling is applied to a lower section of wall — typically in dining rooms, but also in kitchens, hallways and even bedrooms. If you crave old–world elegance in your modern home, wainscoting is an easy, cost–effective way to achieve that look. Depending on the style you select and how you choose to finish your wainscoting, you can create whimsy or elegance, rustic appeal or modern sophistication.

If you choose to panel with wainscoting, it's important to ensure pieces are level. If yours will have a top cap, a router — a power tool used to bevel or round an edge on a square piece of wood — can provide nice detail at the top of panels. Finally, while wainscoting is frequently painted, there's no rule that says you must paint yours. Consider a simple clear sealer or semitransparent stain that will allow the natural beauty and character of the wood to shine through.

Tuesday, April 15, 2014

DALLAS FARMER'S MARKET

Farmers Market
“This is one of the best ideas this city has ever done.”  And with those strong words, Mayor Mike Rawlings picked up a red-tipped shovel and helped break ground on the new-and-improved Dallas Farmers Market, which officially began its $65-million makeover just nine months after a private group took the keys from Dallas City Hall.  Mayor Mike Rawlings introduced the new market with some very high expecations.   The redevelopment will consist of four new restaurants, a grocery store that will serve the southeast portion of downtown Dallas, approximately 300 more apartments and lofts, and a dazzling new Farmer’s Market.  It will be a showplace for Dallas.
-          Dallas Morning News (excerpts), March 28, 2014

Monday, April 14, 2014

Cypress Waters In Las Colinas

Straddled between Coppell and Irving in the city limits of Dallas, Cypress Waters is a dream come true for Lucy Billinglsey, the daughter of Trammell Crow.  
7-Eleven has announced that it is moving its headquarters and 1,000 employees to Cypress Waters.  Cheddars is building their corporate location there and Monitronics Security Systems has announced it is moving from Carrollton to Cypress Waters.  The business parks of Cypress Waters are booming.  Located at the northeast corner of I-635 and Belt Line Road, the development is in the Coppell ISD and the first elementary school is scheduled to open this fall.  More schools are planned.    The forst 800 apartment units are now occupied with some of the most appealing designs and architecture in the Metroplex.    Recently announced was the proposal for upscale restaurants in Cypress Waters on the shores of Northlake.  The dream is now reality, and Lucy Billingsley has made a significant mark in northwest Dallas County.

Wednesday, March 26, 2014

Highest Household Income Neighborhoods in the DFW Metroplex

According to the 2010 U.S. Census
Highest Household Income Neighborhoods in the Metroplex
1: Westlake (Westlake)
Mean Household Income: $526,590, Higley 1000 #12
2: Greenway Parks (Dallas)
Mean Household Income: $511,549, Higley 1000 #15
3: Westover Hills (Westover Hills)
Mean Household Income: $385,047, Higley 1000 #69
4: Old Preston Hollow (Dallas)
Mean Household Income: $338,351, Higley 1000 #158
5: Bluffview West (Dallas)
Mean Household Income: $335,935, Higley 1000 #168
6: Highland Park (Highland Park)
Mean Household Income: $330,032, Higley 1000 #188
7: Oak Tree (Dallas)
Mean Household Income: $327,123, Higley 1000 #204
8: Volk Estates-Windsor Place (University Park)
Mean Household Income: $323,486, Higley 1000 #218
9: Stratford Manor-Armstrong Fairway (University Park)
Mean Household Income: $322,282, Higley 1000 #224
10: Northaven Park (Dallas)
Mean Household Income: $313,955, Higley 1000 #251
11: Preston Hollow (Dallas)
Mean Household Income: $310,471, Higley 1000 #269
12: LakeSide on Preston (Plano)
Mean Household Income: $306,168, Higley 1000 #286
13: Willow Bend (Plano)
Mean Household Income: $304,801, Higley 1000 #296
14: Preston Royal (Dallas)
Mean Household Income: $304,679, Higley 1000 #299
15: Lakewood (Dallas)
Mean Household Income: $301,825, Higley 1000 #320
16: Bent Tree-Oakdale (Dallas)
Mean Household Income: $298,930, Higley 1000 #333
17: Timarron (Southlake)
Mean Household Income: $298,068, Higley 1000 #336
18: Timberlake-Princeton Park (Southlake)
Mean Household Income: $286,828, Higley 1000 #418
19: Bella Lago-River Hills (Flower Mound)
Mean Household Income: $281,696, Higley 1000 #456
20: Brook Meadows-Brighton Oaks (Colleyville)
Mean Household Income: $278,204, Higley 1000 #488
21: Cheyenne Village-Starwood West (Frisco)
Mean Household Income: $277,646, Higley 1000 #495
22: Russwood Acres (Dallas)
Mean Household Income: $275,175, Higley 1000 #523
23: Versailles-Cambridge Place (Southlake)
Mean Household Income: $271,015, Higley 1000 #566
24: University Heights-University Hills (University Park)
Mean Household Income: $266,284, Higley 1000 #620
25: Rivercrest Country Club (Fort Worth)
Mean Household Income: $265,238, Higley 1000 #632
26: Starwood East-Sterling Ranch (Frisco)
Mean Household Income: $265,076, Higley 1000 #635
27: Kings Ridge-Schoal Creek West (Plano)
Mean Household Income: $262,018, Higley 1000 #667
28: Stonebriar North (Frisco)
Mean Household Income: $261,486, Higley 1000 #676
29: Preston Trail Golf Club-Bent Tree Country Club (Dallas)
Mean Household Income: $260,066, Higley 1000 #700
30: Gentle Creek Country Club-Whitley Place (Prosper)
Mean Household Income: $255,529, Higley 1000 #766
31: The Dominion-Highland Oaks (Southlake)
Mean Household Income: $247,070, Higley 1000 #878
32: Denham Village-Whiffletree (Plano)
Mean Household Income: $245,842, Higley 1000 #896
33: Mansfield South (Mansfield)
Mean Household Income: $242,732, Higley 1000 #960
34: Bedford (Bedford)
Mean Household Income: $241,303, Higley 1000 #987
35: Loma Linda-Preston Place (University Park)
Mean Household Income: $240,133, Higley 1000 #998

Monday, March 24, 2014

Margaret Hunt Hill Bridge Dallas Texas

“The Bridge to Nowhere”
The naysayers proclaimed at one time that the proposed Margaret Hunt Hill Bridge at a cost of $93 million was simply a bridge to nowhere.  West Dallas was some of the worst slums in the city.   But the city of Dallas had vision, and today the area that once had some of the worst crime is being transformed into the newest hot spot.  Entire city blocks have been purchased for development.  Great restaurants have opened with more on the way.  There will be stunning views of the city from hundreds of new apartments now under construction.  Retail, shops, grocery stores – all now under construction.   A city once again transformed!

Thursday, March 20, 2014

Energy Boom in Texas is Strong

Energy Boom in Texas is Strong
In Texas, oil and natural gas are synonymous with boom and bust.   A new field or a new technology brings a drilling rush and spectacular wealth.  Then just when nearly everyone has borrowed to the max, the bottom falls out.  Not this time, says John Auers, an oil analyst with Turner,  Mason & Co. engineering consultants in Dallas.   “This is a more sustainable and potentially longer-lasting boom,” he said.  “The early 80s were great times, but they became bad pretty quick.  That will not happen this time.”
-          Dallas Morning News. January 18, 2014

Wednesday, March 19, 2014

Gone to Texas

"Gone to Texas"
“Gone to Texas” was a common statement in the 1800s as people went west.  It is now a common statement again today.   In January, Texas gained 33,900 jobs while California lost 31,500 jobs.  The number one move across the nation is Californians moving to Texas.  It is jobs, it is cost of living, it is no income sales tax.  New home construction is booming across Texas, hence 6,200 of the new 33,900 jobs in December were construction related.   Politically, California is a liberal Democratic state.  Texas is the exact opposite, a conservative Republican state.   The typical Californian moving to Texas is a conservative, making California more liberal and Texas more conservative – day by day.  Two great states, and yet so very different.
-          Dallas Morning News (excerpts), January 15, 2014, January 18, 2014

Monday, January 27, 2014

Can Shadow Inventory Help Relieve Price Pressure?

Can Shadow Inventory Help Relieve Price Pressure?

By Lawrence Yun, Chief Economist, NATIONAL ASSOCIATION OF REALTORS®
Home prices grew at the fastest pace in seven years in 2013. This is good news for property owners, both homeowners and landlords, as they witnessed, on average, a $32,000 gain in housing equity over the past two years.  The equity increase is an immediate financial gain for many.  For others, it marks only a partial recovery.  That is, at the depth of the downturn there were about 12 - 13 million underwater homeowners.  Now, that figure has been essentially slashed in half. 
There is however some bad news along with the quickly rising home values.  Rising home values make it more difficult for first-time homebuyers to make a purchase.  The conditions will be exacerbated by the near-certain case of a rising interest rate environment in the coming years.  In order to lessen the upward price pressure, more inventory is clearly needed.  Homebuilders are raising production, but too late and at too small increments.  Though the most recent housing starts of a 1.1 million annualized pace in November was a solid 30 percent increase from the prior year, the pace is still insufficient.  For all of 2013, housing starts look to finish at 930,000. The long-term, 50-year annual average is 1.5 million housing starts each year.  So the recent past six consecutive years of less than one million new housing units was bound to make an impact on the market.  Existing home inventory is at a 13-year low while newly constructed home inventory is at a 50-year low. 
However, can shadow inventory then save the day in pumping out more homes available for sale?  There are still 2.3 million mortgages that are seriously delinquent (more than 90 days late) or already in the foreclosure process.  This is not counting underwater homeowners, but people who are not paying their mortgage.  Surely, the majority of these distressed mortgages will not ever be made current.  They will instead become REO properties at some point.  Unfortunately, even though 2.3 million seriously delinquent mortgages sound large, they are significantly smaller than what the number had been.  Four years ago, there were 4.3 million in a similar state.  Just one year ago, there were 2.9 million delinquent mortgages.  The bottom line is that we should expect less of an increase in shadow inventory turning into visible inventory. 
Due to differing foreclosure processes, however, some states have a much larger overhang of shadow inventory than others.  In places like Arizona, a homeowner is quickly evicted for being delinquent.  In other places, principally the judicial foreclosure states, the court system has the final say and the overall process tends to drag out for a long time – with a 2 - 3 year time span not uncommon.
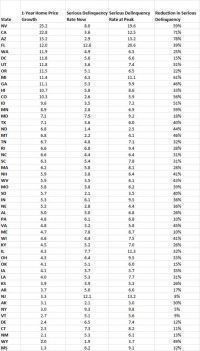
What are the judicial states with continuing, plentiful shadow inventory that can hit the market?  Interestingly, they are in states where inventory shortage is not a problem.  Home-price growth has been sluggish and these states still have a shadow looming over their market.  [Price data used is from the NATIONAL ASSOCIATION OF REALTORS®] The following table shows the serious delinquency rates now and at peak (usually in 2008 or 2009, ranked by the latest home price appreciation for each of the 50 states). 
As one can see, where the inventory would be most welcome, there appears just not enough shadow inventory to help relieve home prices.  The top three, fastest-appreciating states of Nevada, California, and Arizona have reduced seriously delinquent mortgages by roughly 60 - 80 percent.   On the opposite end of those states where seriously delinquent mortgages have been cut by only a little (to the tune of 10 percent or so) - namely New Jersey, New York, Vermont, Delaware, Connecticut, and New Mexico – home price growth has been sluggish.  There are few exceptions to the rule.  Washington D.C., for example, has made only slight progress in reducing seriously delinquent mortgages, yet home price growth has been strong, no doubt due to the stronger employment conditions and from the fact that it already had a relatively low delinquency peak figure.
Lawrence Yun is the chief economist for the NATIONAL ASSOCIATION of REALTORS®. He will be sharing his insider insights on the national and regional housing markets in this new, exclusive column for the Power Broker Report.